

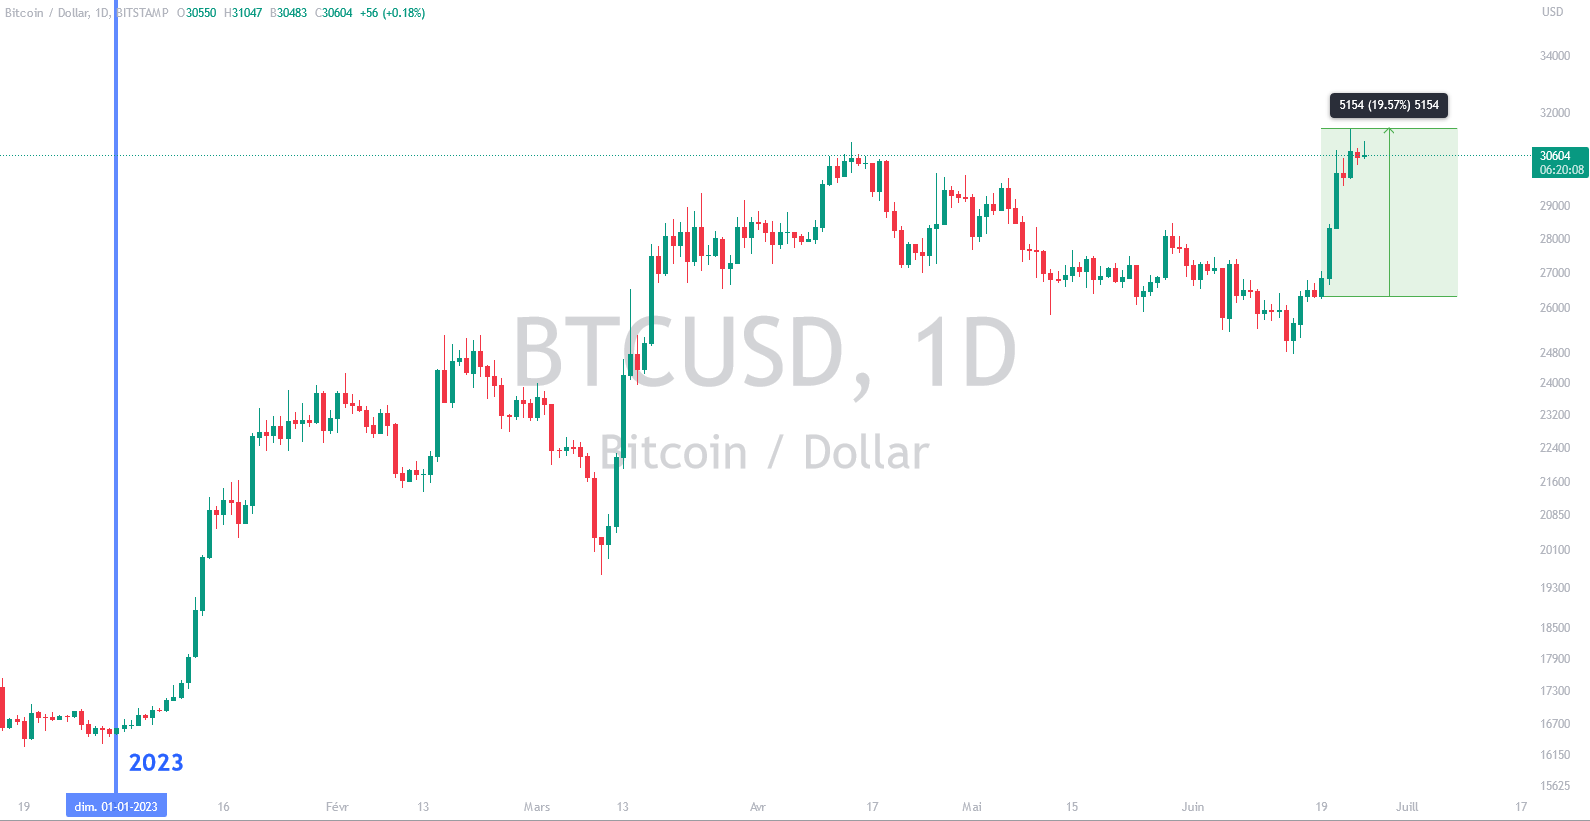
Last week, bitcoin was up 19%. The price of the parent cryptocurrency rose from around $26,000 to around $31,500, marking a new yearly ATH.
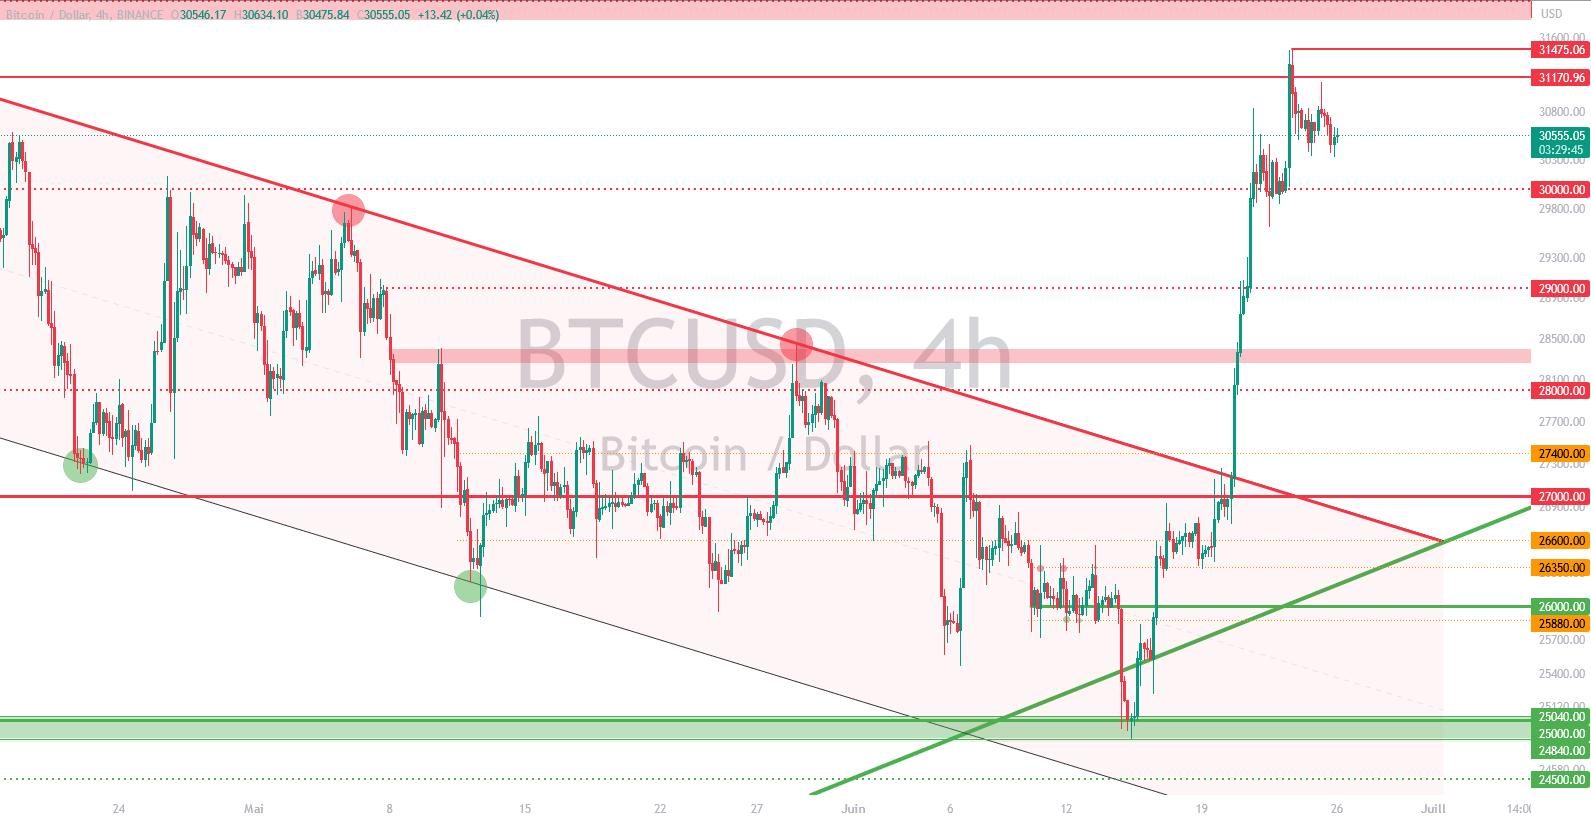
We mentioned in last week’s analysis a potential upside rally. We can say that it is now done. After a slight difficulty in crossing the $27,000 zone, the price of bitcoin quickly soared to $28,000. This last level was not defended, which led to an even larger movement to finally reach a new high for this year 2023, slightly above $31,000. We can say that the bearish trendline that Bitcoin has followed since mid-April 2023 is now behind us.
The current technical analysis was carried out in collaboration with Elie BR, passionate investor and trader in the cryptocurrency market. Today a trainer at Family Trading, a community of thousands of own-account traders active since 2017. You will find Lives, educational content and mutual aid around the financial markets in a professional and warm atmosphere.
Bullish continuation?
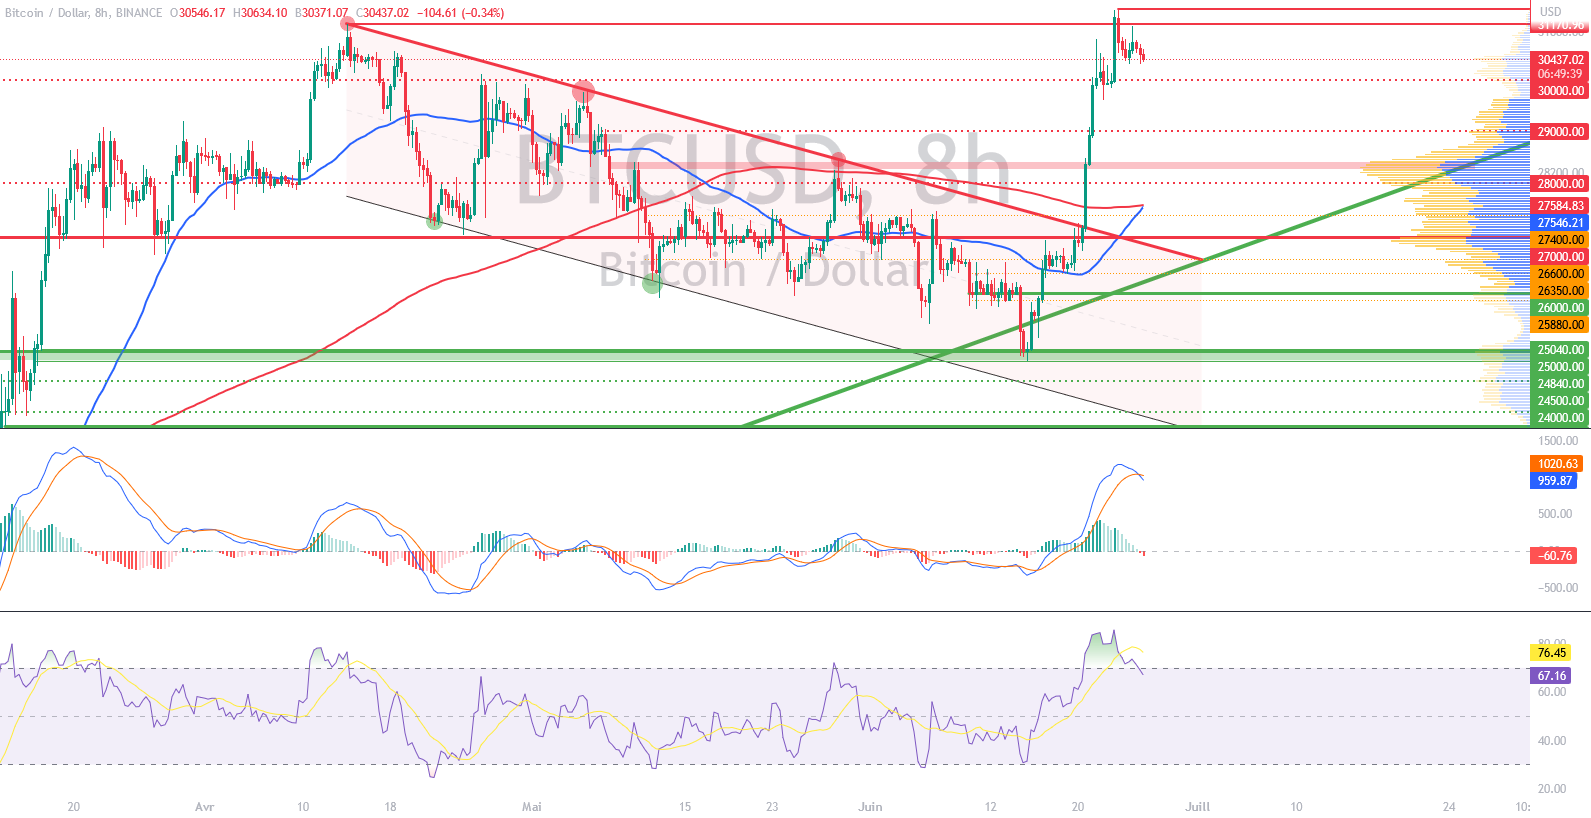
Despite this parabolic rise, we can now highlight a slight exhaustion of buyers thanks to oscillators such as the MACD or the RSI.
MACD stands for Moving Average Convergence Divergence. Translated into English as Moving Average Convergence, the MACD is a technical indicator primarily used to identify trends and potential reversal points on price charts. It uses two exponential moving averages to measure price changes.
However, from a structural, chartist or cyclical point of view, everything suggests that bitcoin should continue to rise.
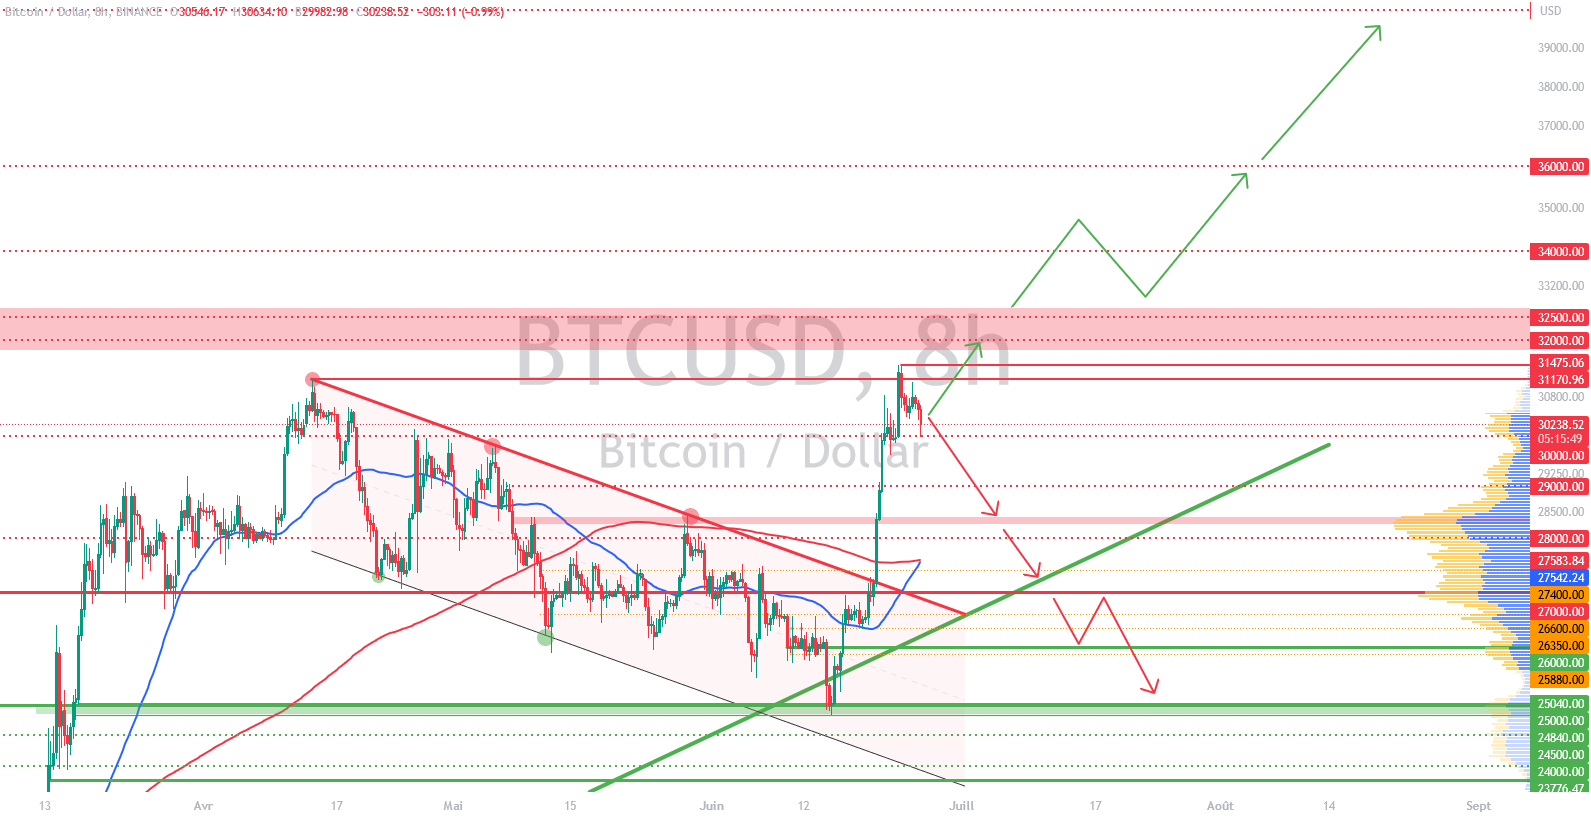
Bitcoin Price Assumptions
1/ For a bullish scenario on the price of BTC, it would take a brief breakout of $32,000 in order to hope to find $34,000/35,000, a level corresponding to an unfilled bearish gap on futures contracts… The breakout from this zone could give us an ever more bullish horizon towards $40,000, a psychological level, located slightly below the 50% Fibonacci retracements from bitcoin’s ATH.
2/ For a bearish scenario on the price of BTC, we should consider a return and a breakout of 28,000/27,000 dollars. This zone is between the 50% and 61.8% Fibonacci retracements from its last impulse from $25,000 and is visibly well supported by the VRVP. Thus, if this last zone is not defended, one could easily imagine a return to $25,000 and more if the sellers have a monopoly.
3/ The last scenario would be more boring with a large consolidation around 29,000 and 31,000 dollars.
Conclusion
To the delight of bitcoin holders, the price of the parent cryptocurrency has resumed a nice upward momentum. These latest movements are intended to be reassuring for a possible bullish continuation on the price of BTC, leaving behind more supports, but be careful to keep your feet on the ground. A correction is not inevitable and could scare investors into bear profits. Thus, it will be important to carefully observe the reaction of the price on the different identifiable levels to confirm or not the different hypotheses made. Beware of potential “fake outs” and “market squeezes” in each situation. In addition, it should be remembered that these scenarios are based solely on technical analysis. The price of cryptocurrencies can change more or less quickly, depending on other more fundamental factors.
Receive a digest of news in the world of cryptocurrencies by subscribing to our new service of daily and weekly so you don’t miss any of the essential Tremplin.io!


