
A month ago, we specified that “the bullish force of this rebound [engagé depuis novembre 2022] runs out ». As a result, the technical breakout let us see that “a first major support is also identifiable at around $24,850”. It is a level that has precisely acted as a rebound zone in recent weeks. Now, the accelerated corrective movement has been confirmed, but it was not large enough to speak of a bearish movement. A move above $30,000 would now be a potentially very bullish setup.
A bitcoin still below its historical standard…
A common method in statistical analysis is to adjust prices by their historical linear progression. An asset that would follow a perfectly linear long-term trend line can be easily anticipated. Bitcoin (BTC) is a bit of an exception to this observation in that it follows a logarithmic trendline. Nevertheless, the study of the linear trend of bitcoin brings up an interesting observation.
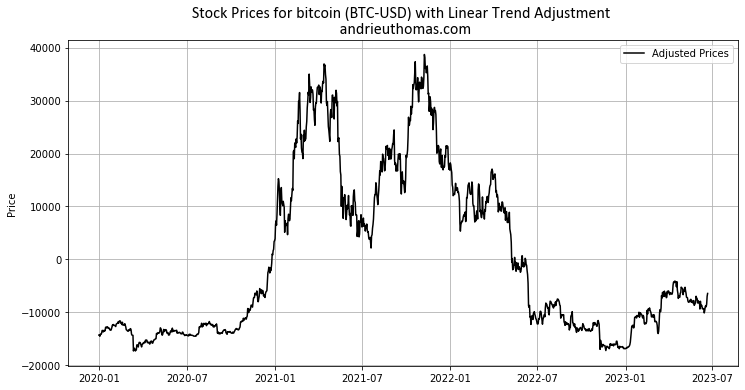
Indeed, we first observe that the low of the end of the year 2022 corresponds to the (adjusted) price levels of spring 2020! The chart above shows the price of bitcoin against the trend line observed between 2020 and 2023. Moreover, we observe that a price “normally linear” bitcoin would instead be around $30,000 to $32,000 in June 2023. But this should in no way be considered as an objective but only a benchmark. Also, the risk of loss is obviously more moderate in the long run if the entry comes in below the trendline.
A persistent trend
Another important statistical element is given to us by the study of fractals. Fractals can be used to detect persistent or anti-persistent market behavior. In fact, fractals consist of the repetition of temporal figures (cycles) over various time horizons. This may for example involve the comparison of daily figures with monthly figures. Degree “autocorrelation” between these figures specific to an asset is measured by the Hurst coefficient.
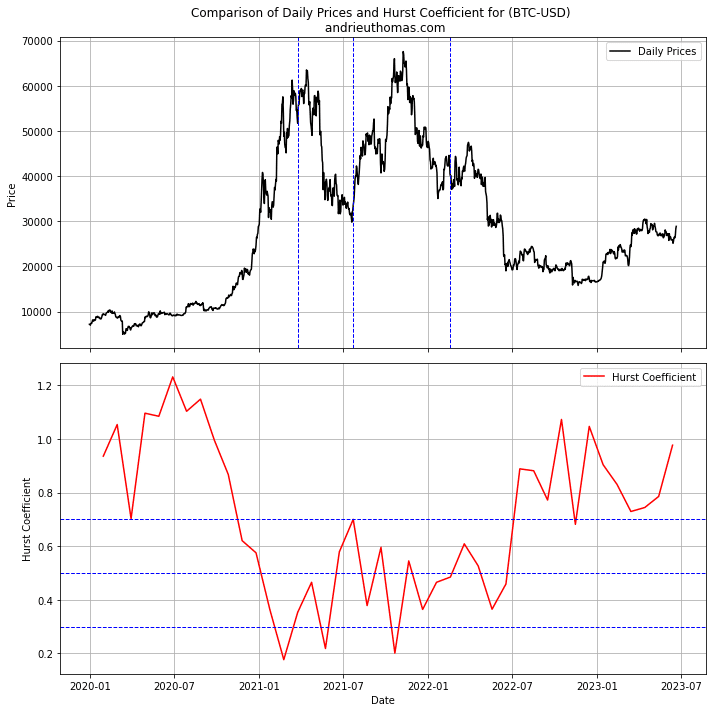
The Hurst coefficient is usually between 0 and 1. It may exceptionally happen, on very volatile assets such as bitcoin, that the coefficient exceeds 1. Generally, a coefficient greater than 0.5 indicates a persistent positive trend. Conversely, a coefficient below 0.5 indicates a persistent negative trend.
In the case of bitcoin, the measurement of the Hurst coefficient (red curve) shows an interesting efficiency. A high value of the Hurst coefficient rather signals a bullish reversal in the price of bitcoin. Thus, a decrease in the Hurst coefficient on bitcoin more accurately reflects a rise in the price of bitcoin. Therefore, bitcoin highs are usually accompanied by Hurst Coefficient lows around 0.2. Conversely, a Hurst coefficient above 0.7 or around 1 rather signals an entry zone.
In the current configuration, the Hurst coefficient has risen towards 1 following the correction towards $25,000. This signal is therefore rather neutral or slightly negative in the short term. Nevertheless, any bullish recovery would be likely to be supported from a statistical point of view. In particular, a passage of the Hurst coefficient below 0.7 could trigger a more significant upward movement.
Buyers will take over?
During the corrective movement initiated at the beginning of June, we observed that the sellers had led the dynamic. But the trend is set to reverse. The graph below shows the cumulative daily variations of bitcoin. Thus, an indicator permanently above 0 implies a greater buying force than the selling force. Ideally, any lasting market reversal should be accompanied by a crossing of the 0 line.
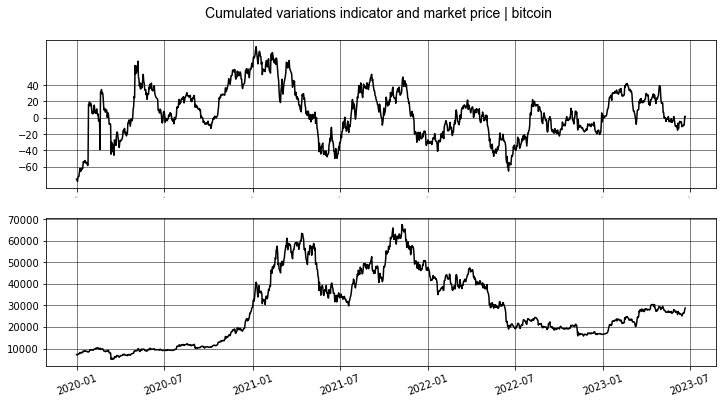
Lately, the exit of the corrective movement is accompanied by an overshoot of the line 0 of the cumulative variations. That is to say that we are in the presence of two favorable elements. Thus, a return to $30,000 with recurring or sustained upward variations would be likely to trigger very positive dynamics.
The need to have significant short-term variations
It would take an increase in daily volatility, or a decrease in monthly volatility, to witness the arrival in a real bull market. This is at least what emerges from statistical analysis based on fractals. Indeed, volatility peaks often accompany the price of bitcoin. We also specify, following our previous publication, the need for volatility during the phases of the rise of bitcoin (BTC). Indeed, we noticed that ” bitcoin price highs are synchronized with index volatility lows” . On the other hand, ” the lows of the bitcoin price are synchronized with a maximum (negative) correlation with the volatility of the indices!” .
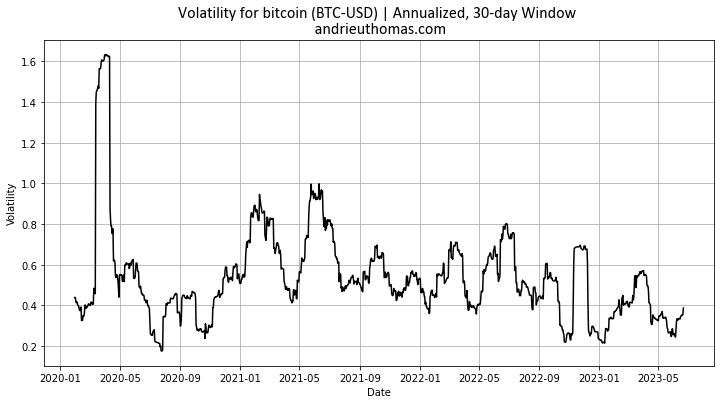
The current low volatility of bitcoin precisely suggests the existence of a high Hurst coefficient. Consequently, and in view of the two statistical observations stated, the upside potential of bitcoin is reinforced. Despite everything, the level of correlation of bitcoin with the volatility of the S&P 500, although negative, is not strong enough. We are therefore entering a period where the major movements of the indices are not necessarily followed by the price of bitcoin.
Significant changes to come?
In fact, the study of extreme variations can be very useful. A trend is rarely driven and built without strong variations that confirm the evolution of market psychology. It has now been nearly 3 months since we have seen a strong variation (-12% or +12% for example). Clearly, it is likely that we will see significant variations in the coming weeks.
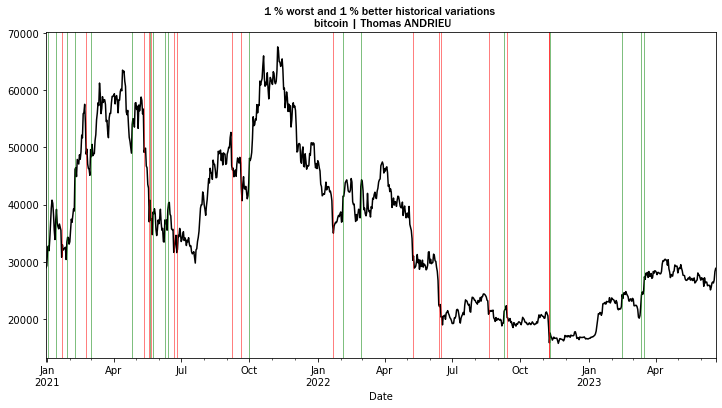
The last significant changes occurred in March and confirmed the exit from the bear market. New variations of this type, in the presence of a powerful market rebound, would be likely to continue the trend. The analysis of strong variations joins that of volatility and fractals.
What objectives?
We have seen that the bearish (corrective) movement anticipated last month has manifested. The magnitude of the decline nevertheless quickly ran into the major support at $24,800. It is also an oblique support built since the beginning of the year. In our last analysis, we projected the following plan. The sustainable crossing of $25,000 did not occur, and the bullish recovery was strong.
“A return below $25,000 would signify a longer-lasting corrective move, when a breakout of $33,000 would obviously be a very bullish signal. The future of the trend will be given by the magnitude of the variations (the statistical forces) recorded in the coming weeks. »
Statistical analysis of bitcoin (BTC) – Tremplin.io
The first major level which would be the logical continuation of our analysis is the previous summit. The latter is between $30,000 and $31,000. This threshold is not neutral because it would mark the return of bitcoin beyond its long-term linear trend. Breaking this level with sufficient statistical forces (as described in our analysis) would cause entry into a bull market. We will therefore be particularly attentive to the extent of the next variations in bitcoin, the return of volatility, and the persistence of this trend.
In conclusion
- The expected corrective movement has been confirmed. But the $25,000 zone was preserved, which leads to the continuation of the rise since January.
- Bitcoin price is still below its long-term linear trend. We are therefore not in a statistically abnormal increase. On the contrary, the $30,000 threshold is a key long-term threshold that could be crossed again.
- The study of fractals shows that the trend could be continuing. However, without a sustained return to volatility, bitcoin’s rise will be complicated. A change in the Hurst coefficient around 0.7 would be clearly positive.
- In addition, the buying force tends to regain the upper hand over the selling force. This signal is rather quite positive and the strong recent rebound goes in this direction.
- Additionally, bitcoin’s volatility is still low, which limits the potential for movement.
- Consequently, more significant variations in the coming weeks would be likely to favor a more lasting rise. This would lead to positive signals on all the indicators listed.
Ultimately, the $30,000-$31,000 area would be the next major threshold. Its crossing with volatility and conviction would be a very powerful signal. In the opposite case, a more lasting correction could be envisaged with an exit from the uptrend since January. But this hypothesis remains minor following the recent rebound in prices.
Receive a digest of news in the world of cryptocurrencies by subscribing to our new service of daily and weekly so you don’t miss any of the essential Tremplin.io!